

Build Once, Harvest Everywhere The Semantic Ecosystem
Stop building dashboards. Start building assets.

That sounds crazy, right? But hear me out.
In my last article, Why the Semantic Model is Your Most Valuable Asset, we established a hard truth: Your visual report is disposable, but your Semantic Model is the gold in the vault.
But an asset sitting in a vault earns zero interest. You need to invest in it.
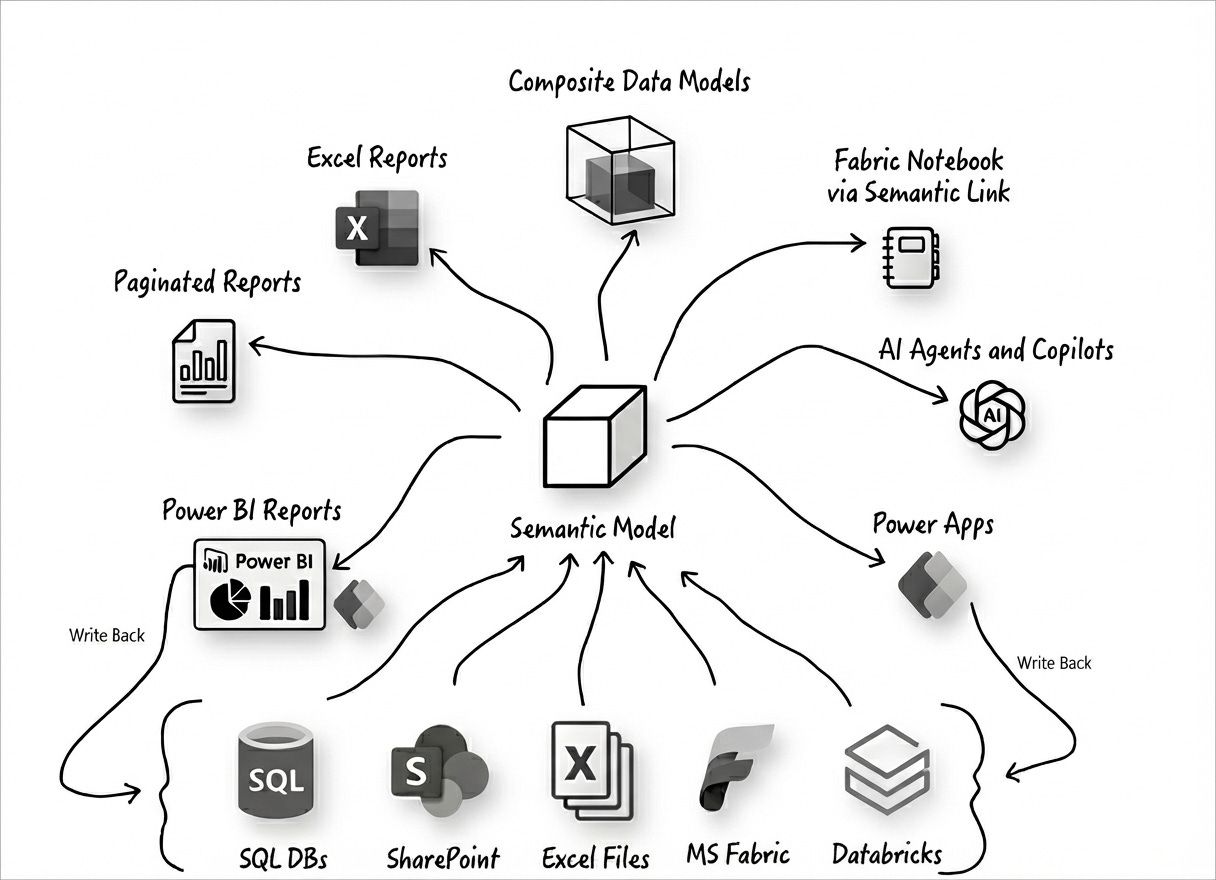
Too many organizations treat their Semantic Models like single-purpose tools. They build a sophisticated model, slap one report on top of it, and call it done. That is a massive waste of ROI. In a mature Data Architecture, the Semantic Model isn’t just a data source for a dashboard—it is the Solar System of your entire organization.
The Semantic Model is the Sun. Burning bright in the center, it holds the “Single Version of the Truth.” Orbiting around it are different ways to consume that truth.
Here are the 7 Ways to Harvest Your Semantic Model to ensure every person in your company—from the CEO to the Data Scientist—is looking at the same star.
1. Power BI Reports (The Interactive View)
Target Audience: Executives & Managers
The Method: Live Connection (Web/Desktop)
This is the standard use case. We build interactive, visual dashboards to spot trends and outliers. We all know this one.
The Architect’s Note: Remember that the report is just a skin. If you delete the report file tomorrow, your business logic (Measures, KPIs, Security) remains safe in the model. Never put business logic in the visual layer; keep it in the model so the other 6 tools below can use it.
2. Paginated Reports (The Document View)
Target Audience: Operations & Regulatory Compliance
The Method: Power BI Report Builder
Sometimes you don’t need a dashboard; you need a pixel-perfect invoice, a regulatory PDF, or a 50-page operational list that prints perfectly on A4 paper.
Paginated Reports connect to the same Semantic Model to generate these formal documents. This ensures that the numbers on the invoice match the numbers on the dashboard exactly.
3. Excel (The Financial View)
Target Audience: Finance & Controllers
The Method: Power Pivot / DAX Table Expressions
Finance teams generally do not want bubbles and maps; they want grids, pivots, and ad-hoc analysis. Instead of forcing them to export data to CSV (creating “Excel Hell” and version control chaos), you give them a Live Connection.
Using “Analyze in Excel,” they connect directly to the Semantic Model. They can browse the exact same “Gross Margin” measure as the CEO, but they do it in their native language: Pivot Tables. One model, two interfaces.
4. Composite Data Models (The Extension View)
Target Audience: Departmental Analysts (”Shadow IT”)
The Method: DirectQuery for Power BI Datasets
This is the ultimate “Ecosystem” feature. It allows a local department (like HR or Marketing) to connect to your corporate “Golden Dataset” and extend it with their own local Excel files or flat files.
They don’t rebuild your work; they build on top of it. They harvest your core architecture while maintaining the flexibility to add their own local analysis.
5. Semantic Link (The Scientific View)
Target Audience: Data Scientists & Python Developers
The Method: Microsoft Fabric (sempy library)
This is the game-changer introduced in Microsoft Fabric. Historically, Data Scientists had to rebuild business logic in Python to run forecasts because they couldn’t read Power BI files.
Now, using Semantic Link, they can import your Power BI measures directly into their Python Notebooks as a Pandas DataFrame. Your Machine Learning models now speak the exact same language as your Financial Reports. No more “Two Versions of the Truth.”
6. AI Agents & Copilot (The Conversational View)
Target Audience: Everyone
The Method: Natural Language Query (NLQ)
This is the newest planet in our solar system. Executives can now ask, “Why is Gross Margin down in Europe?” and the AI agent harvests the answer directly from your measure definitions.
Technically, Copilot acts as a Translation Layer. It translates English into a DAX query, executes it against your model, and renders the result. This makes your Semantic Model the “Vocabulary” for the company’s AI. If your metadata is clean, your AI is smart.
7. Power Apps (The Action View)
Target Audience: Frontline Workers
The Method: Power Automate Bridge / Native Integration
Dashboards are passive; they show you what happened. Apps are active; they let you fix it. By connecting a Power App to your ecosystem, frontline workers can “harvest” context from the model (e.g., “Stock is low”) and take action.
The Harvest: The App reads the data (via Power Automate or Native Integration).
The Action: The user clicks “Restock.”
The Write-Back: The App writes the transaction back to the Source System (SQL/Dataverse), closing the loop between insight and action.
The Verdict
If you are a Solution Architect, your job isn’t to build a Report. Your job is to build the Sun.
Once you have a solid, well-governed Semantic Model, you can let the users choose their own telescope. Whether they use Excel, Python, or a Mobile App, they are all looking at the same truth.
Build once. Harvest everywhere.
Want to dive deeper? Browse the full library by category on the Topics Page.