

Why the Semantic Data Model is Your Most Valuable Asset
In the age of AI and Data Lakes, the humble Semantic Model remains the "Heart" of modern business

Introduction: The Evolution of Tech
I want to share my reasoning on why the Power BI Semantic Model is, as of today, your organization’s most valuable analytics asset.
First, we must admit that technology is evolving at breakneck speed. New tools emerge every day. Three years ago, we heard about ChatGPT for the first time. Today, you only need to look at the LM Arena leaderboard to see how many new AI models are emerging and competing for dominance: Gemini, Grok, Claude, and so on.
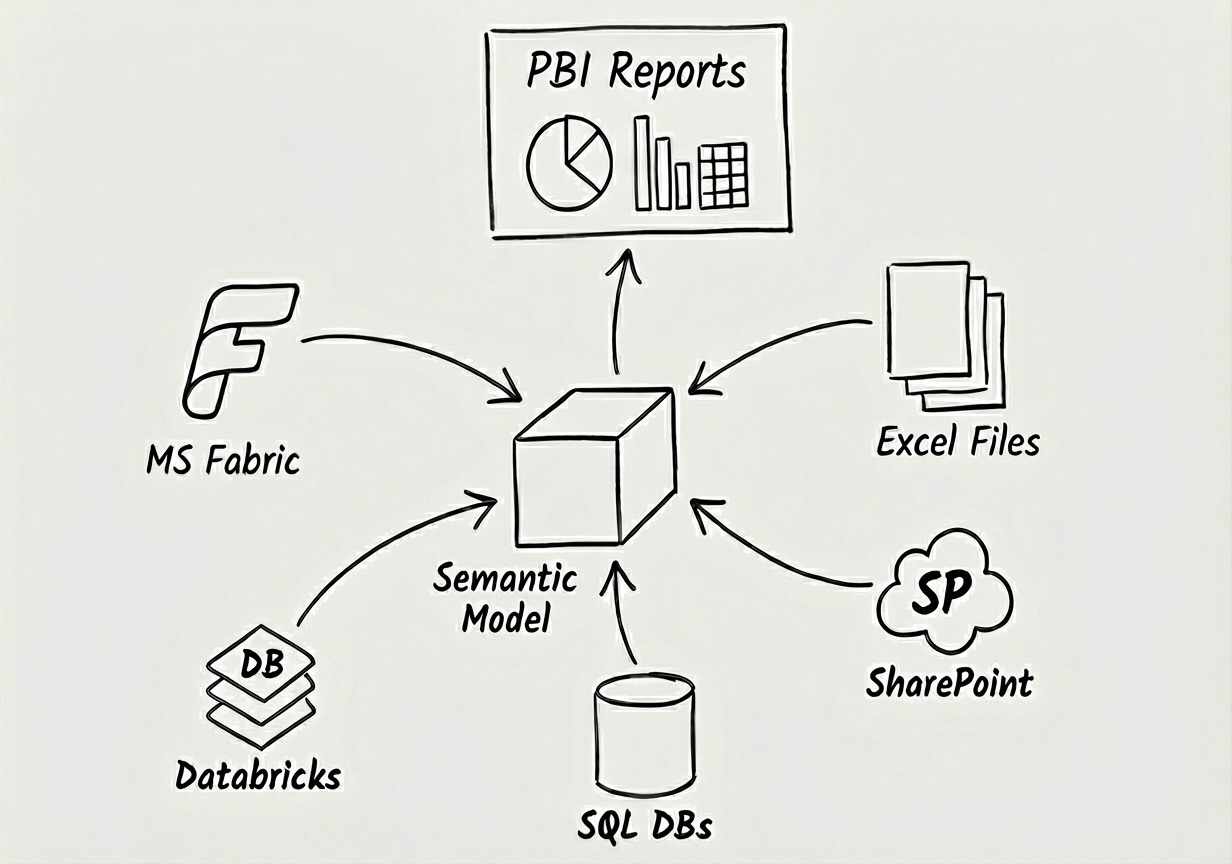
The data landscape is shifting just as fast. We have modern environments providing the “Data Lake” concept, like Microsoft Fabric, Databricks, and Snowflake. And let’s not forget the traditional data storage tools that still run the world: SQL databases, SharePoint lists, and finally, physical files like Excel or CSV.
The Problem: The Distributed Truth
Traditionally, medium and large-sized organizations maintain multiple tools and solutions in parallel. This creates a fragmented reality where the answer to a business question lies distributed among them.
Customer data is in Salesforce.
Budget data is in Excel.
Transactions are in an ERP system.
This is where the power of the Semantic Model shines. It acts as a central Hub in the middle, consolidating this data in one place, ready to serve the business.
What is a Semantic Model? (The Abstract View)
Before we talk about tools, let’s talk about the concept.
Technically, a semantic model is a copy of your data with defined relationships, collected from different sources. It is compressed to be incredibly space-efficient and operates in RAM (Random Access Memory) to be super fast. Conceptually, this is the classical BI architecture used among several enterprise tools, whether it be QlikView, Tableau, or Power BI.
The first thing to understand is the Data Model and its Relationships.
Initially, we should look at the data model in an abstract way, on the business level. For example, an organization will always have Products, Customers, and Sales. These are facts. For a moment, we do not care that Products are defined in SAP, and Customers and Sales are in Salesforce.
Having just these three business entities, we can already draw the schematic data model and define the relationships.
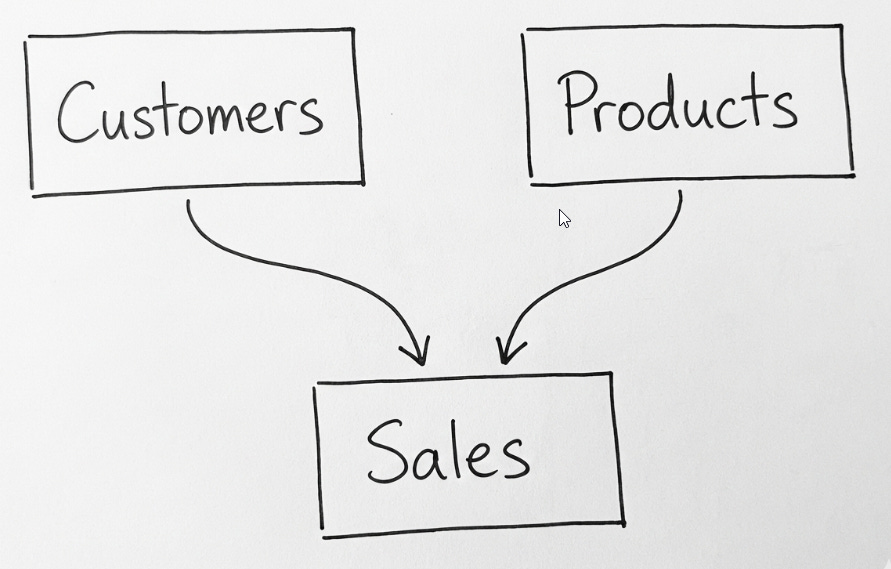
What do we mean by the lines connecting them? These represent Key Columns, like Customer ID or Product ID.
Usually, all Customers in the Customer table have a unique Customer Key.
The Sales table can contain thousands or millions of rows, documenting sales of different products to different customers during a defined period.
The Foundation: The Star Schema ⭐
When defining the logical data model, we should strive to achieve the Star Schema. It is the best compromise to achieve the best performance, storage efficiency, and query flexibility later on.
In a Star Schema, the tables of the semantic model fall into two categories:
Dimension Tables: These describe the “Who, What, Where.” They usually have a unique value column (like Customer ID or Product ID).
Fact Tables: (Sometimes called Transactional tables). These store the details about multiple business transactions (like Sales) and do not have unique columns.
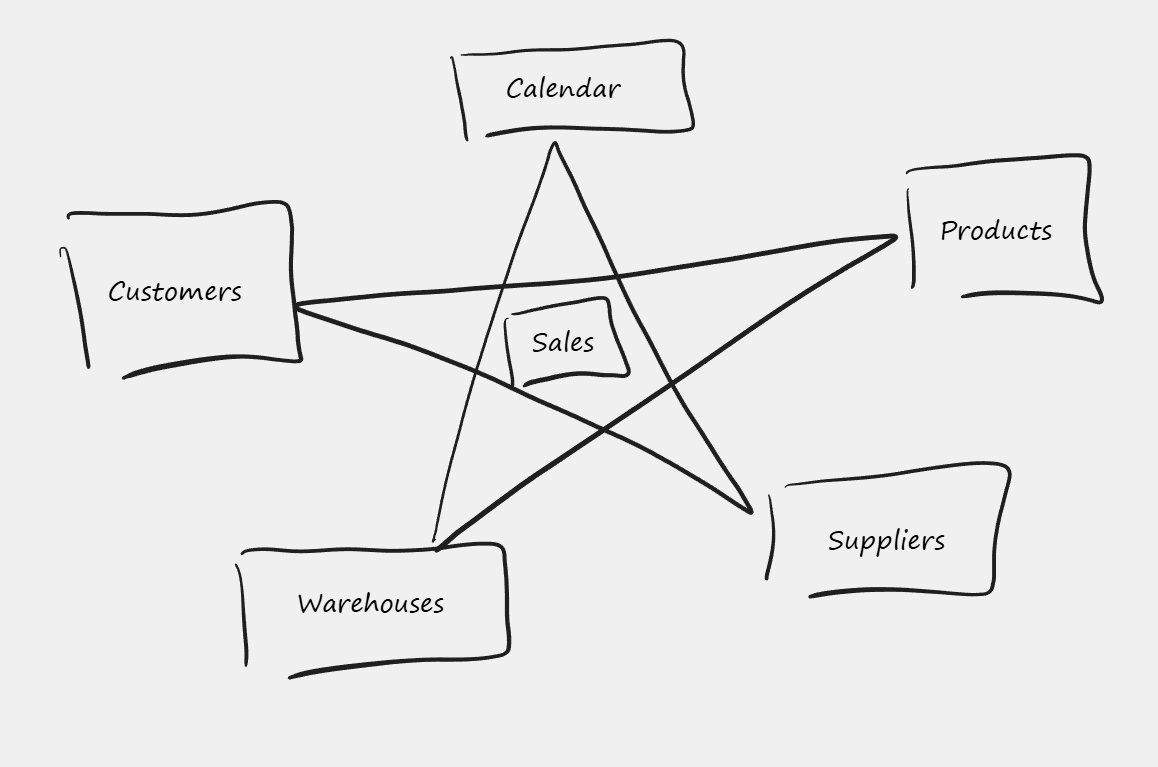
Why is this called a Star Schema? Because the drawing looks like a star: one Fact table in the center, surrounded by many Dimension tables.
The “Architect’s View”: Top-Down Flow
In reality, the data model might be more complex. It might have two or more fact tables, like Sales and Budget.
So, I advise against thinking about the “Star” visualization too literally. A much better habit is to place Dimension tables at the top of your drawing, and Fact tables below.
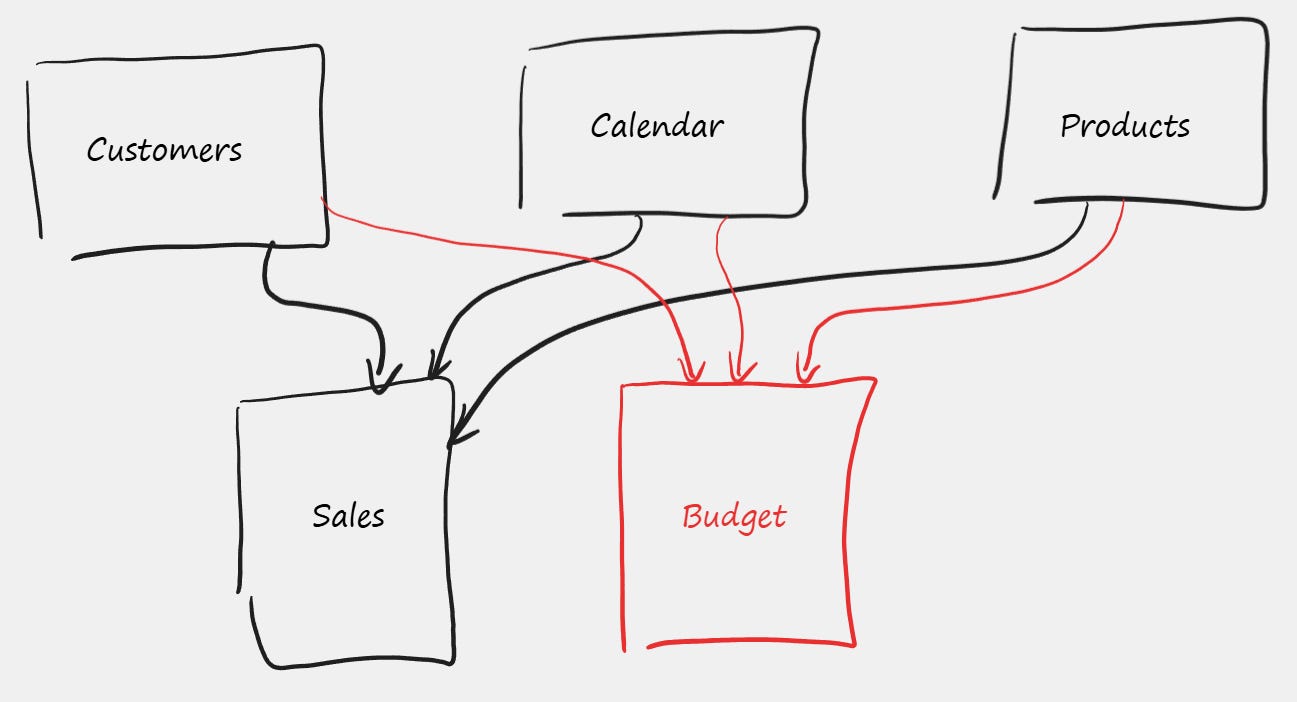
The reason placing Dimensional tables at the top is better is because later, when we deal with the concept of Filter Directions, it will be much easier to visualize “Top-Down” flow scenarios. Understanding that filters flow downhill is crucial to understanding the model’s behavior.
The Alternative: Why Not One Big Table?
Just before leaving the concept of the Star Schema, let’s ask ourselves: what are the alternatives?
One alternative would be one large Flattened Table—like one giant Excel spreadsheet constructed with the help of XLOOKUP, containing data from Customers, Products, and Sales all in one row.
Technically, this is possible, but only as long as we have one fact table in the model (like Sales).
As soon as we introduce a second fact table—like Budget—the flat table approach breaks. You would need two separate flattened tables: one based on Sales and one based on Budgets.
This introduces Data Redundancy, as data from Customers, Calendar, and Products is stored twice.
This uses expensive RAM memory inefficiently.
One advantage of a flattened table is that it is extremely fast at querying time. However, I maintain that the Star Schema is the best compromise between speed, space, and scaling up flexibility.
The “Back-End”: The Importance of ETL
Now that we have covered the abstract layer of the semantic data model, we need to cover the importance of the ETL part.
ETL stands for Extract, Transform, Load.
For example, if the Customer Data resides in the Salesforce system, we need to extract that data into the semantic model. But we rarely want to load it “as is.” We want to apply Transformations first.
Column Selection: We might select only the most important columns to save memory.
Joins: We might join “Order Headers” and “Order Lines” tables to flatten them into a single transaction table.
Quality Assurance: The ETL stage is the perfect time to clean errors and ensure data quality.
From my experience, the ETL part is the most important phase. This is where most of the investment value is kept.
From Abstract to Concrete: The Microsoft Stack 🛠️
So far, everything I have described—Star Schemas, ETL, Relationships—is universal. You apply these principles whether you use Qlik, Tableau, or SAP HANA.
But as a Microsoft Specialist, my tool of choice is Power BI.
In the Microsoft ecosystem, the “Semantic Model” is a specific artifact powered by the Vertex (formerly xVelocity) engine. It lives inside Power BI or Analysis Services (SSAS). And to make this model intelligent, we don’t use generic SQL; we use a specific, powerful language called DAX (Data Analysis Expressions).
This is where we move from “Theory” to “Implementation.”
The “Brain”: DAX Measures and Intelligence
At the center of our Power BI model, we have the relationships and the data. Now we add the components that make the model intelligent: Calculated Tables, Calculated Columns, and Measures.
Calculated Tables: If there is a need, it is possible to add new tables to the model using DAX. A prime example is the Calendar table, which is mandatory for Time Intelligence calculations.
Calculated Columns: Similarly, we can add new columns derived from existing data.
Measures: Finally, we arrive at the most powerful concept in the Microsoft stack.
A Measure is like a formula residing on top of the semantic model. From a logical point of view, a measure should be seen as disconnected from any particular table. A measure is like a predefined unit of intelligence, delivering a specific answer from the semantic model.
Measure 1: [Sales Amount] could calculate SUM(Sales[Qty] * Sales[Price]).
Measure 2: [Sales Budget] could sum the budget table.
Measure 3: [Sales vs. Budget] could calculate the variance by utilizing the previously defined measures.
The complexity and the value of measures can grow up to infinity.
The Payoff: Answering Business Questions
Finally, we have arrived at the Harvesting part.
So far, we have invested heavily: we did the ETL, we created relationships, and we defined DAX measures. Now, we are ready to ask the semantic model the real business questions.
What are the top sold products this year?
How is each product category doing compared to the budget per Region?
How many returning customers did we get this year?
The number of business questions is unlimited. So, what are the tools to start asking these questions?
1. Reports and Visuals (The GUI) We can see the report and visuals (pivot tables, dashboards, or diagrams) as a GUI (Graphical User Interface) to send business questions to the semantic model and present the received answers visually. The report is interactive, not static. When users play with slicers, they are technically resending slightly modified questions to the semantic model and instantly seeing the response.
2. Beyond the Dashboard But the GUI report is not the only option. Because the logic lives in the Model, not the Report, we can use other client tools to send questions:
Excel: Using Power Pivot Tables or DAX Table Expressions, connected to the model.
Paginated Reports: For detailed lists.
AI Agents: Using natural language to query the model on the fly.
Summary
Technically speaking, this semantic model lives inside Microsoft’s Analysis Services (SSAS) software. This software engine is running inside the Power BI Service, but you can also find it locally within Power BI Desktop, or even buried inside your local Excel installation.
Once the semantic model is published, and different client tools are defined, the only thing left to do is to schedule the periodic data refresh.
The report is temporary. The visuals are just the interface. The Semantic Model is the asset.
Architect’s Note: I wrote this article intentionally before reading Christian Wade’s recent post on the same topic, to ensure my architectural view remained unbiased.
It turns out we landed on very similar conclusions regarding the Semantic Model’s role as an accelerator. If you want to read the official Microsoft engineering perspective, I highly recommend his article here:
Want to dive deeper? Browse the full library by category on the Topics Page.
Vilmantas Lialko is a Senior Solution Architect at TECHOICE.
Connect with me on LinkedIn: Vilmantas Lialko
Need help with Power BI architecture? Visit www.techoice.se to learn about our consulting services.